
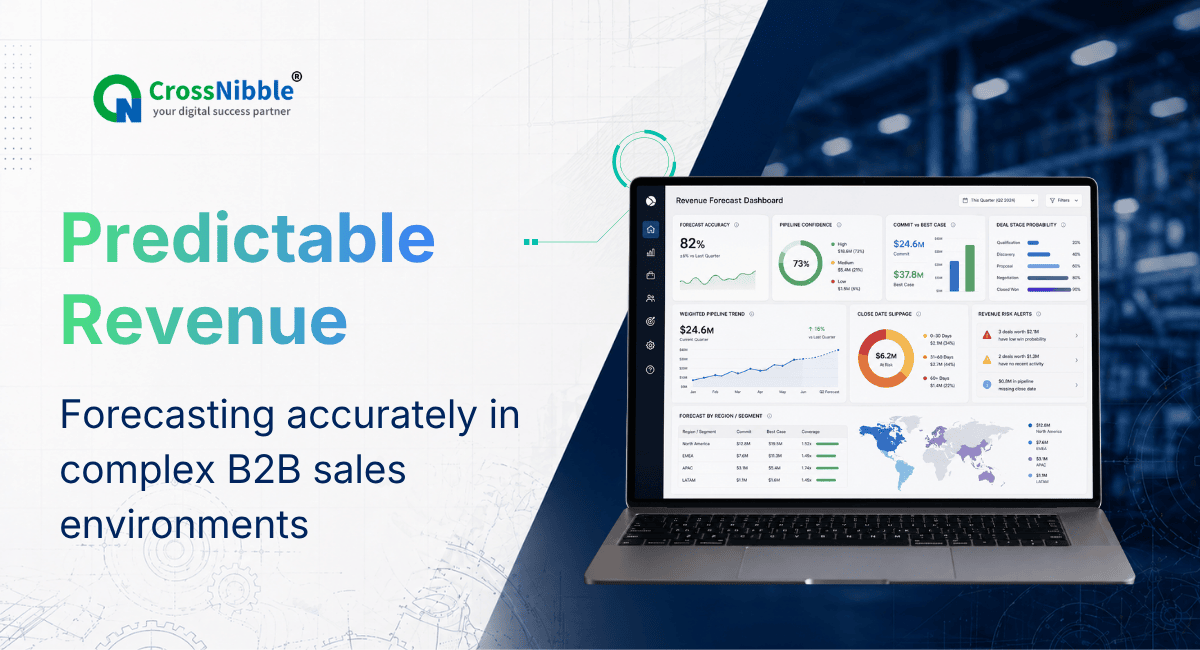
Revenue forecasting in industrial B2B businesses is fundamentally different from transactional industries.
Manufacturers and industrial service providers often operate in environments where:
- Sales cycles range from 3 to 18 months
- Projects move through multiple validation stages
- Procurement decisions involve several stakeholders
- Technical and compliance approvals take time
- Order values fluctuate significantly
In such environments, traditional forecasting methods fail.
Leadership teams frequently rely on:
- Intuition
- Historical averages
- “Strong pipeline feeling”
- Expected tender wins
This approach creates volatility, especially when scaling.
Forecasting in long-cycle B2B markets requires structural discipline.
1. Why Traditional Forecasting Models Fail in Industrial Markets
Most conventional forecasting assumes:
- Short sales cycles
- Stable deal sizes
- Predictable monthly conversion rates
- High volume of transactions
Industrial businesses operate differently.
Challenges include:
- Low deal frequency but high deal value
- Stage-based technical validation
- Client-side budget approvals
- Project-based demand spikes
- Variable procurement timelines
If forecasting relies only on historical revenue patterns, leadership remains reactive.
Predictable growth requires stage-based pipeline intelligence.
2. Understanding the Anatomy of a Long-Cycle Deal
A typical industrial deal progresses through:
- Initial enquiry
- Technical discussion
- Feasibility evaluation
- Sample or prototype stage
- Compliance validation
- Commercial negotiation
- Procurement approval
- Order confirmation
Each stage has:
- Different probability of closure
- Different duration
- Different stakeholder involvement
Forecasting must assign structured probabilities to each stage.
Without stage-level visibility, pipeline value becomes inflated or misleading.
3. Moving From “Pipeline Value” to “Weighted Pipeline Value”
Many companies calculate pipeline as:
Total value of all open opportunities.
This creates false optimism.
Instead, weighted pipeline should be calculated:
Opportunity value × stage probability
For example:
- Early technical discussion may carry 20 percent probability
- Sample approved stage may carry 60 percent probability
- Commercially finalized stage may carry 80 percent probability
Weighted forecasting produces a realistic revenue outlook.
CRM discipline is essential for accurate stage definition.
4. Tracking Sales Cycle Duration by Segment
Not all industries convert at the same speed.
For example:
- Automotive suppliers may move faster due to recurring cycles
- Aerospace may require longer compliance validation
- EPC-based infrastructure projects may follow seasonal funding cycles
- Enterprise software implementation may require extended stakeholder alignment
Forecasting should track:
- Average cycle length per industry
- Stage duration per segment
- Drop-off rate per stage
Segment-based forecasting improves precision.
5. Identifying Leading Indicators, Not Lagging Metrics
Lagging metrics include:
- Monthly revenue
- Orders booked
- Closed deals
Leading indicators include:
- Number of qualified enquiries
- Movement between pipeline stages
- Sample approvals
- Technical validation completions
- Procurement review entries
Leading indicators signal future revenue before orders close.
Long-cycle forecasting depends on leading signals.
6. Revenue Concentration Risk Analysis
Forecasting must account for concentration risk.
If:
- 40 percent of projected revenue depends on one large project
- One client represents significant share of pipeline
- One industry dominates forecast
Risk increases.
Leadership should assess:
- Revenue distribution by industry
- Revenue distribution by client
- Revenue distribution by geography
Diversified pipelines produce more stable forecasts.
7. Integrating Repeat Order Forecasting
In long-cycle B2B markets, repeat orders often create stability.
Forecasting should include:
- Expected reorder cycles
- Contract renewal probability
- Historical repeat frequency
- Seasonal ordering patterns
Repeat revenue can be forecasted more accurately than new acquisition.
Combining new pipelines with repeat projections improves reliability.
8. Forecasting Beyond Revenue: Capacity Alignment
Revenue forecasting must connect to operations.
Key questions include:
- Can projected orders be supported by capacity?
- Does forecast justify machinery investment?
- Are hiring plans aligned with expected demand?
- Is inventory procurement synchronized?
Without capacity alignment, the forecast becomes theoretical.
Integrated forecasting supports strategic planning.
9. Improving Forecast Accuracy Through CRM Discipline
CRM must capture:
- Industry segment
- Application type
- Estimated deal size
- Stage progression
- Stakeholder involvement
- Expected decision timeline
- Lost reason categorization
Accurate data input determines forecast reliability.
Inconsistent CRM usage undermines forecasting.
10. Service Providers Face Similar Forecasting Complexity
Industrial service firms such as:
- Automation integrators
- ERP consultants
- Engineering design companies
- Compliance advisory firms
Operate with:
- Long proposal cycles
- Multi-stage validation
- Contract negotiation delays
Forecasting must include:
- Proposal submission tracking
- Technical validation stage
- Stakeholder alignment indicators
- Retainer renewal probability
Structured stage mapping improves visibility.
11. Moving From Optimistic Forecasting to Probabilistic Forecasting
Optimistic forecasting assumes:
“All active opportunities will close.”
Probabilistic forecasting assumes:
“Each stage carries measurable probability.”
This shift requires:
- Clear stage definitions
- Historical conversion rate analysis
- Data discipline
- Regular pipeline review meetings
Forecasting becomes mathematical rather than emotional.
12. Leadership Review Cadence
Forecast accuracy improves with structured review cycles.
Monthly reviews should assess:
- Movement between stages
- Industry-specific performance
- Stage-level bottlenecks
- Lost deal patterns
- Segment concentration risk
Quarterly reviews should assess:
- Industry growth contribution
- Client diversification
- Forecast vs actual variance
- Repeat revenue stability
Regular discipline strengthens predictability.
13. Digital Authority Influences Forecasting Accuracy
When digital positioning strengthens:
- Qualified enquiries increase
- Industry alignment improves
- Sales cycles shorten
- Conversion rates stabilize
Improved conversion consistency improves forecast accuracy.
Digital authority indirectly stabilizes forecasting models.
14. The Leadership Mindset Shift
In long-cycle B2B markets, leadership must move from:
“We expect strong revenue this quarter”
to:
“Our weighted pipeline supports projected revenue with defined probability.”
Forecasting becomes:
- Structured
- Data-backed
- Segment-aware
- Risk-adjusted
- Capacity-aligned
This maturity level distinguishes scalable industrial businesses.
Final Perspective
Revenue forecasting in long-cycle B2B environments cannot rely on intuition or historical averages alone.
It requires:
- Stage-based pipeline mapping
- Weighted probability modeling
- Segment-specific cycle tracking
- Repeat order forecasting
- Concentration risk monitoring
- CRM discipline
- Capacity integration
Forecasting transforms from guesswork to system intelligence when pipeline architecture is structured correctly.
In industrial markets, predictability is engineered.
Revenue stability begins with visibility into stage-level reality.